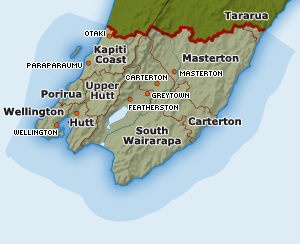
Wellington Regional Council

Chair: Chris Laidlaw
Councillors in 2016: 12 (excluding Chair)
Council employees in 2018: 516
Councillors in 2016: 12 (excluding Chair)
Council employees in 2018: 516
Key financial statistics 2018
| $ (in thousands) | Wellington Regional | Median for all REGIONAL councils | New Zealand |
|---|---|---|---|
| Public Equity | 1,107,412 | 545,448 | 123,568,227 |
| Operating Revenue | 300,793 | 52,522 | 9,879,372 |
| Operating Expenditure | 313,189 | 55,532 | 10,292,961 |
| Capital Expenditure | 59,333 | 11,570 | 4,887,998 |
| Rates Revenue | 122,788 | 20,915 | 5,815,327 |
- Source: Local Authority Financial Statistics, Statistics New Zealand
The financial profile pages for this council contains more detailed information.
The Council's current long-term plan and annual report may be available from its website: www.gw.govt.nz
Community statistics as at the 2013 census
| Usually resident population - 2013 Census | 471,315 |
|---|---|
| Usually resident population - 2006 Census | 448,956 |
| Change from 2006 to 2013 (All NZ: 5.3%) | 5.0% |
| Land Area km2 (not incl. inland waters or oceanic areas) - 2014 | 8,049 |
| People per km2 (All NZ: 15.9) | 58.6 |
| Median personal income - 2013 Census (All NZ: $28,500) | 32,700 |
- Source:
- Census, Statistics New Zealand
View more QuickStats about the Wellington Region on the Statistics New Zealand website.